Welcome to the Winter edition of On the Marc. In this edition, we will review markets for the last quarter of the 2024 financial year and consider the outlook for the foreseeable future.
Market update
There was a notable skew in returns in financial year 2024 (FY24) across both sectors and size cohorts. The ASX20 (the top 20 stocks) rose by +14.9% while the mid-caps (ASX50 through to 100) rose by just +6.6%. This disparity was explained by the underperformance of mid-cap resources, which fell by -25.7% over the year versus the ASX20 financials that were up by +32.3%. The MidCap 50 Industrials were up a more respectable +14.9%.
It is interesting that over FY24 the big four banks had a +34.9% return, +6.9% from dividends and +28.0% from share price appreciation. Of the +28% capital growth, -2.2% was due to earnings growth (i.e. forecast earnings went backwards), while PE re-rating contributed +30.1%. PE stands for Price Earnings and is calculated by dividing the current share price by profit per share. PE rerating happens when the price of a stock rises without any growth in earnings, just based on future earnings growth potential. Even more extraordinary is that the PE valuation went up despite US and Australian 10-year bond yields (which are typically inversely correlated to PE valuations) increasing by +56 basic points (bp) and +29bp, respectively. The following chart shows the PE ratio of the Australian share market over time. With the current PE well above long-term averages, it suggests that company profits are going to increase significantly in the coming years or that shares are currently overpriced.
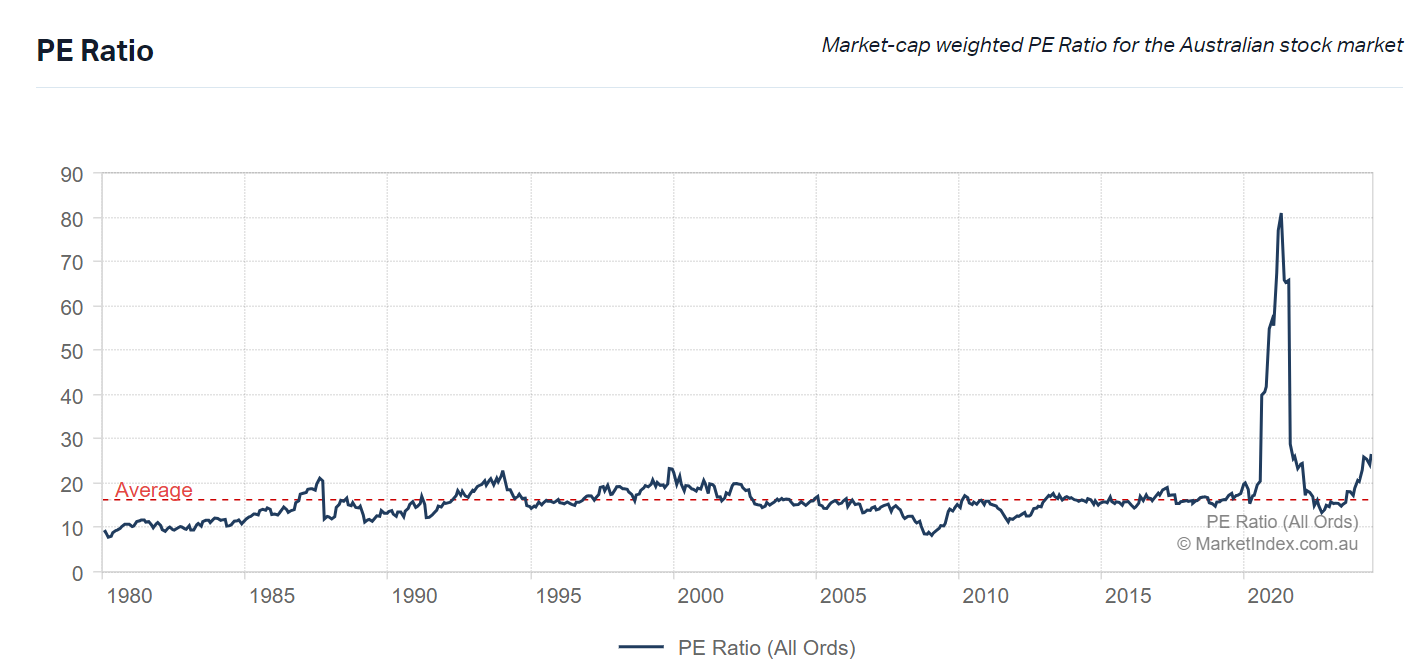
Source: Market Index as at 25 July 2024
Given the very large rerating in FY24 and minimal forecast earnings growth for the banks over the next three years, further price appreciation in the banks will be challenging. This may limit the gains in the broader indexes and will benefit active management.
The Australian economy has been slowing since late 2022, with the first quarter of 2024 gross domestic product (GDP) growing just 0.1%. Per capita GDP has been in decline for five quarters, and annual GDP growth has been the weakest since 1992. While this would ordinarily see interest rate cuts by the RBA, government spending is still growing at around 4%, with policy in areas of industrial relations and energy transition contributing to persistent inflation. This situation of inflationary federal government policy was made worse during the quarter when the states announced large budget deficits for the coming year.
In May, Australian headline inflation reached 4.0% versus the consensus of 3.8% year on year (YoY). The largest contributors were in services; insurance +7.8%, housing +5.2% and education +5.2%. By contrast, food was +3.3% and clothing +2.8%. This was the third consecutive monthly increase in inflation (and upside surprise to consensus) after the low of +3.4% in February. Even more concerning is the trimmed mean inflation, the number the RBA looks at, which reached +4.4% YoY in May. Given the RBA’s cash rate of 4.35%, real interest rates (i.e., the level of the RBA cash rate above inflation) are barely positive. To effectively reduce inflation in past cycles, real rates needed to be over 2%. This stands in contrast to other central banks, such as the Fed, which have had real rates in the range of +2.5-3.0% and, therefore, have been more effective in reducing inflation.
In contrast, China is a country that doesn’t have any issues with inflation and is experiencing quite the opposite. Overcapacity now exists well beyond housing, with PPI (prices paid by goods producers and tends to lead consumer price inflation by around nine months) in negative territory. The Chinese government’s supply-side economic management has seen utilisation rates fall sharply to 50-65% in recent quarters in the investment priority sectors of solar panels, lithium batteries and electric vehicles. The manufacturing sector, more broadly, is suffering from excess capacity, which it’s seeking to fill by exporting more goods at reduced prices. This is leading to protectionist policies from the US and EU, which will only exacerbate the Chinese deflation. The impact of the excess supply can be seen in commodity markets with surpluses in the lithium sector now forecast to last until late this decade. While emerging Asian markets such as India, Indonesia, and Vietnam are growing rapidly, Chinese government policy support remains poorly directed and insufficient to lift the economy out of the doldrums.
In the USA, the S&P 500 and Nasdaq continued to move higher. Contrary to last quarter, when there were signs of a broadening in the market rally across sectors, USA returns this quarter were concentrated in mega-cap technology stocks—most notably NVIDIA, Apple, and Microsoft. The top five holdings in the S&P 500 now make up ~29% of the index, the highest concentration in 50 years.
European markets were generally negative, as French elections and their impact on the country’s future fiscal sustainability weighed on the broader region.
Market returns for major indices
Below is a table showing the percentage returns of the major market indices to 30th June 2024.

Source: Bloomberg, Lonsec
The outlook for the year ahead
Our view remains that economic growth is slowing, not crashing. Inflation is well in hand on a global scale and is likely to continue to trend down over time, although there will be bumps along the way, and energy prices can be a wildcard.
Below the surface of relatively solid macro data, we are seeing many industries and businesses showing signs of an accelerating slowdown. Consumers remain under pressure, particularly lower socioeconomic consumers who are more susceptible to increased cost of living. Central Banks, almost by definition, are reactionary, and Chair Powell has repeatedly reiterated the Fed will respond to economic data. He also recognises the risks of holding rates too high for too long. There is an increasing risk that the Fed is behind the curve in cutting rates, as it previously was slow in raising rates to curtail inflationary pressures.
A Trump election victory would likely have a positive impact on small business confidence, US domestic investment and lower energy prices. It would also likely lead to higher tariffs, which would be inflationary in the USA (and deflationary in China). However, this impact would likely take time to come through.
A Democratic Party candidate election would boost union membership and companies in the renewables space requiring subsidies.
Did you know?
The market’s performance has been extremely narrow. In the first half of 2024, Nvidia alone contributed over 30% of the increase in the S&P500 Index!

Source: Standard and Poor’s as at 11th June 2024
Final reMarc
The outlook is positive, and we expect a much broader number of companies driving returns in the year ahead than in the past year. Domestic household lifestyle spending will continue to be restrained as we approach the final leg of fixed home loan rates rolling over to variable interest rates. The governments (state and federal) continue to increase spending on various infrastructure projects, resulting in budget deficits for the year ahead. This spending, along with inbound migrants, is central to continued economic growth.
As there has always been, the share market will continue to experience volatility (both up and down). However, any downturn is considered temporary in nature when looking at the big picture, and it is important this is kept at the forefront of investors ’ minds as trying to time the market is extremely difficult and attempting to do so leads to a far less optimal outcome.
" It's good to test yourself and develop your talents and ambitions as fully as you can and achieve greater success; but I think success is the feeling you get from a job well done, and the key thing is to do the work. "
Peter Thiel
Key Facts & Figures
The Australian Cash Rate was kept on hold in July at 4.35%.
The RBA Cash Rate is likely (78% chance) to remain on hold in August when the RBA next meets (22% chance of a rate cut).
Our annualised inflation rate is 3.6%. This is well above the upper end of the RBA’s target band of 2 - 3%.
Australia’s unemployment rate is 4.1%.
The US Federal Reserve cash rate band is 5.25% and 5.50%.