Welcome to the Winter edition of On the Marc. In this edition, we will review markets for the second quarter of the 2023 calendar year and consider the outlook for the foreseeable future.
Market update
Global equity markets were mixed over the quarter with performance driven by different themes in each region. One of the common threads driving performance was the rally in technology stocks globally, as artificial intelligence and ChatGPT dominated headlines.
In the USA, consumers generally remain resilient despite some evidence of product downgrading and a shift to greater value-for-money products. We believe this is due to the low levels of unemployment and the high proportion of long-term (10- to 30-year) fixed-rate mortgages which shield consumers from the recent aggressive interest rate rises. In the USA, over 90% of homeowners currently have a mortgage rate below 6%, with 60% of mortgage holders enjoying interest rates below 4%, despite mortgage rates for new borrowers being close to 7%.
Compare this to Australia, where ~60% of borrowers are currently on variable rates. This figure is expected to shift to ~90% over the next 12 months as low fixed-rate mortgages (typically ~2% p.a.) roll-off. Due to this high and growing variable interest rate exposure, rate rises are likely to have a much more pronounced impact on discretionary spending in Australia than in the USA.
Asian markets were sharply lower as data from China’s re-opening recovery disappointed. European markets rose modestly, led by Financials and technology stocks as inflation showed signs of moderation.
The Australian market was broadly flat (ASX200 +1.0%), with strong performance from the Technology sector offset by weakness in Materials and Consumer Discretionary names. Weaker Chinese re-opening data weighed on the Resources sector, with the RBA’s non-consensus interest rate hike in June and hawkish outlook further dampening investor sentiment.
From a commodities perspective, there are challenges with major new projects as they are becoming far costlier to build and taking much longer as companies navigate a myriad of regulatory, taxation and local community issues.
The key factor driving markets over the calendar year has been the rally in mega-cap Technology stocks which has produced strong gains in the S&P500 and Nasdaq. There are a number of interesting dynamics surrounding this rally.
First is the narrow level of market leadership. The performance of the S&P500 concentrated amongst just eight companies – Facebook/Meta, Apple, Amazon, Netflix and Google/Alphabet (FAANG) + Microsoft, Nvidia and Tesla (MNT) has driven around 80% of the gains over the calendar year-to-date and added 13.0% to index returns (refer to below chart). The remaining 492 stocks have cumulatively added only 3.9% to index returns.

Sourc: Golman Sachs Investment Research as at 30 June 2023
Market returns for major indices
Below is a table showing the percentage returns of the major market indices to 31st July 2023.

Source: Lonsec
The outlook for the year ahead
With the current extreme level of crowding and overvaluation in high-multiple Growth/ Technology stocks a cautious outlook is taken at present especially towards the major USA indices. Previously this overvaluation has been an indicator of inflection points in market leadership and should support a reversion to other parts of the market that have lagged, are undervalued and are under-owned.
On the positive side, inflation pressures are likely to continue to moderate over the next six months. Consumer spending and house prices remain relatively resilient and interest rates are likely nearing peak levels. However, given the rally in markets over the last few years, we believe there is a level of complacency priced into markets currently, given the risks that lie ahead and the potential for further economic speed bumps.

Source: L1 Capital
The Australian housing market is likely to continue to see sideways to small upward monthly gains as we are close (or at) the end of interest rate increases. Financial markets are pricing in interest rates to be where they are today in 18 months time.
Did you know?
Global oil consumption has hit record highs. We are consuming 102.5 million barrels per day, above the previous high of 102.3 million barrels per day in August 2019. In other words, we use enough crude oil to fill about 6,500 Olympic-size swimming pools daily. More than a third of those swimming pools would be needed to quench the thirst of two countries; the US and China. This means no relief at the bowser for petrol prices any time soon!
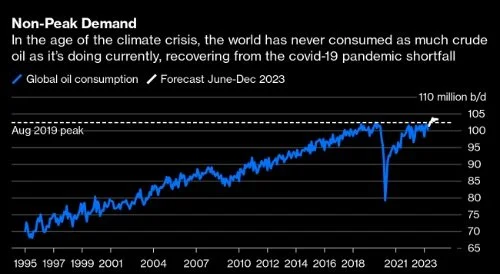
Source: Bloomberg, International Energy Agency, JODI, EIA
Final reMarc
We continue to focus our investment philosophy on building our clients’ portfolios, utilising several specific fund managers who approach portfolio construction in varying ways. This provides diversification with the aim of reducing downside exposure during significant pullbacks so that consistent returns are achieved over time when compared to more basic index style investing. Needless to say, we also expect to deliver superior returns over time net of fees and taxes to cash/term deposit products. Most of our global fund managers currently own a couple of the significant technology companies due to the recent immense appreciation in share prices, and they believe there are better opportunities elsewhere. The outlook remains positive, albeit harnessed by the rapid increase in interest rates globally in the past fifteen months.
"A person who is happy is not happy because everything is right in his life, he is happy because his attitude towards everything in his life is right."
Sundar Pichai
Key Facts & Figures
The Australian Cash Rate was kept on hold in August at 4.10%.
The RBA Cash Rate is likely (95% chance) to remain on hold in September when the RBA next meet.
Our annualised inflation rate is 6.00%. This is well above the upper end of the RBA’s target band of 2 - 3%.
Australia’s unemployment rate is 3.5%.
The Federal Reserve cash rate in the US has risen to between 5.25% and 5.50%.