Welcome to our Winter edition of On the Marc. In this edition, we will review the markets for the 2020 financial year and consider the outlook into the foreseeable future.
Market update
The final quarter of the financial year experienced strong returns with the Australian and world share markets up 17%, gold +12% and oil +92%. The sharp turnaround from the previous quarter surprised most market participants. There were no surprises from the Reserve Bank of Australia (RBA), which left interest rates (monetary policy) on hold each month since March which, had two rate cuts. In the July announcement, the RBA was more confident that the downturn will be less severe than initially feared and made no mention of the worsening outbreak in Victoria. The RBA did note that the nature and speed of the recovery are highly uncertain and dependent on containing the virus. Consistent with this uncertainty, the RBA repeated its commitment to do “what it can” to support jobs, incomes and businesses. The risk is that the RBA will have to do more, but this is likely to focus on more quantitative easing as the RBA continues to see negative rates as being “extraordinarily unlikely” in Australia. The cash rate is expected to remain at 0.25% for at least the next three years.
On the data front, while ANZ job ads rebounded 42% in June, they are still down 45% on a year ago. Other data was soft, with the AIG’s services PMI (manufacturing index) remaining weak at 31.5 in June (in contrast to the CBA measure, which rebounded strongly to 53.1), the ANZ Roy Morgan consumer confidence showing another decline on the back of bad news in Victoria and housing finance plunging 12% in May, pointing to ongoing weakness in the property market. The following chart shows home loan lending for purchases falling month on month since February.

The recent surge in coronavirus cases and the associated negative headlines are starting to impact economic activity, with our weekly Economic Activity Trackers for the US and Australia faltering further over the past fortnight. These activity trackers are based on high frequency data for restaurant bookings, confidence, retail foot traffic, box office takings, hotel bookings, credit card data, mobility indexes and jobs data. Both the US and Australian Economic Activity Trackers fell over the past fortnight, with Australia seeing weaker readings for consumer confidence, retail foot traffic, restaurants and mobility indexes.
Economic recoveries never go in a straight line, but it’s clear that this one will be very bumpy, as coronavirus continues to rear its ugly head and as the reverberations on businesses, jobs and households continue well into the future. Economists expect the Deep 'V' rebound reflected in recent data to give way to a slower, bumpier recovery going forward. In saying this, the share market and the economy don't necessarily move in tandem as illustrated coming out of the Global Financial Crisis (GFC) wherein 2009 the share market started the longest bull market in history.
Major global economic events
The US non-manufacturing ISM index rose sharply in June, jobless claims continued to fall, and job openings and hiring rose in May. The labour market is still very weak, and as noted earlier, more recent economic data indicates some faltering lately, with the resurgence in new coronavirus cases.
Eurozone retail sales rebounded by a stronger than expected 17.8% in May, but the recovery in German factory orders and industrial production was less than expected.
Japanese household spending and wages fell more than expected in May, but the Economy Watchers household and business sentiment indicators rose more than expected in June.
Chinese inflation remained weak in June, indicating that there is no constraint on further stimulus from the People’s Bank of China (PBOC). CPI inflation edged up to 2.5% year-on-year due to higher food price inflation, but core inflation fell to just 0.9%. Meanwhile, total credit was stronger than expected in June, accelerating to 12.8% year-on-year.
Market returns for major indices
Below is a table showing the percentage returns of the major market indices to 30th June 2020.
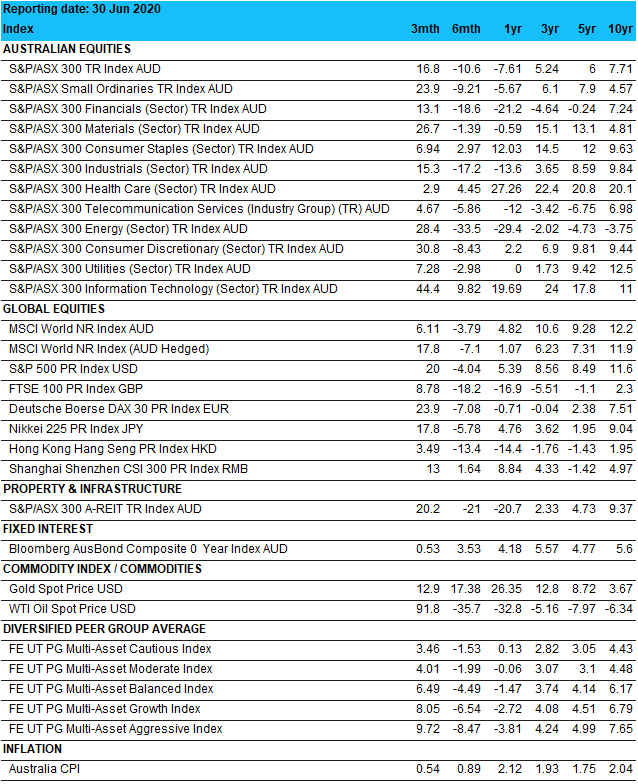
Source: Bloomberg
The outlook for the year ahead
After a strong rally from March lows, shares remain vulnerable to short term setbacks given uncertainties around Coronavirus, economic recovery and US/China tensions. For the medium to long term time frames, shares are expected to see good total returns, helped by a pick-up in economic activity and policy stimulus.
Low starting-point yields are likely to result in low returns from bonds for quite some time once the dust settles from Coronavirus.
Unlisted commercial property and infrastructure are ultimately likely to continue benefiting from a resumption of the search for yield. Still the hit to economic activity (and hence rents) from the virus will likely weigh heavily on near term returns.
The Australian housing market has already slowed in response to Coronavirus. Home prices are falling and higher unemployment, a stop to immigration and rent holidays pose a major threat to property prices into next year. Home prices are expected to fall by around 5 to 10% into next year, with the risk of more significant falls if the renewed rise in coronavirus cases leads to a renewed generalised lockdown. Melbourne is particularly at risk on this front, as its renewed lockdown pushes more businesses and households to the brink.
Cash and bank deposits will provide meagre returns given the ultra-low cash rate of just 0.25%.
Although the Australian dollar is vulnerable to bouts of uncertainty due to Coronavirus, the economic recovery and US/China tensions, a continuing rising trend is likely if the threat from coronavirus recedes. Particularly with the US expanding its money supply far more than Australia is via QE and with China’s earlier recovery supporting demand for Australian raw materials - assuming political tensions between Australia and China are kept to a minimum.
President Trump’s approval rating continues to trend down (and his disapproval up), heightening the risks that he concludes he has nothing to lose by ramping up tensions with China beyond the current (mostly) war of words in a way that threatens the economic outlook to shore up his base.

Did you know?
It seems like we’ve had new records every day of the week in tech, so some of the interesting ones are summarised below:
Amazon shares broke $3,000 for the first time on Monday, it also added the entire market cap of American Express (AXP) in one day (Monday 6th July), while in the week prior it added the entire market cap of UPS (United Parcel Service). On average in 2020, the rolling one-week change in Amazon (AMZN) market capitalisation is equivalent to the whole market cap of EBAY (which has doubled from its March lows).
On Tuesday (7th July), Tesla traded $29.5 billion notional (at the average share price of $1,390), while SPY traded $25.9 billion notional. Yes, Tesla traded more notional than the largest ETF in the world.
The top 3 Big Cap names of Apple, Microsoft, and Google back in March of 2009 (when markets started to rally after Financial crisis) had a combined market cap of ~$350 billion. Now they are around ~$5.8 trillion ~18x times!
Coming into Friday (10th July) the big 5 (Amazon, Apple, Microsoft, Google & Facebook) have added a collective ~$410bn in market cap in July month to date alone (five sessions)- that is bigger than the current market cap of every other S&P500 company (500 largest companies in the US). Amazon alone has added $160 billion in market cap, which is more than the current market cap of ~93% of the S&P500.
Nearly 50% of Nasdaq is now essentially five companies, and those same companies occupy over 22% of S&P500. These 5 companies only represent around an aggregate of 11% of S&P500 total trailing profits (although their debt contribution to S&P500 is zero). Compared to the peak of dotcom (1 March 2000) the top 5 companies represented 17% of the index and approximately 5.2% of profits.

Source: Citi
Final reMarc
Shares are still vulnerable to a further correction or consolidation, particularly if the renewed rise in coronavirus cases in the US and Australia leads to a renewed generalised lockdown and if the recovery in economic indicators continues to falter. The coming US presidential election could also add to volatility. Against this, shares should ultimately be supported by record amounts of cash on the sidelines, cautious investor sentiment, further policy stimulus and ultra-easy monetary policy. Investing with fund managers that focus on companies that are making money, have low debt and profits expected to increase in the coming years continue to form the foundation of client portfolios.
"My attitude is that if you push me towards something that you think is a weakness, then I will turn that perceived weakness into a strength."
Michael Jordan
Key Facts & Figures
Australian Cash Rate remains at the record low of 0.25% with no change since being reduced twice in March.
Interest rates are poised to remain at current record low levels for the next three years.
Our annualised inflation rate is 2.2%. This remains at the lower end of the RBA’s target band of 2 - 3%.
Australia’s unemployment rate has risen from 5.2% to 7.1% in the past quarter.
In the US, the Federal Reserve has kept rates at the record low set in March with the range between 0% and 0.25%. The markets are pricing in no change
for the next three years.