Welcome to the Autumn edition of On the Marc. In this edition, we will review markets for the first quarter of 2024 and consider the outlook for the foreseeable future.
Market update
Equity markets moved higher over the March quarter as U.S. economic data continued to surprise to the upside relative to market expectations. 2024 U.S. Real GDP growth forecasts have increased 90bps since the start of the year, from 1.3% to 2.2%, as consumer spending remains strong, employment data remains resilient, and manufacturing data is recovering. This means a U.S. recession is unlikely to take place.
The strength of the economic data more than offset a hawkish repricing of monetary policy expectations. At the start of this year, the market was expecting seven 25 basis points (bps) interest cuts, with the first cut expected in March 2024. Subsequently, this has shifted to two 25bps interest rate cuts, starting in the back half of 2024. This contrasts with the three cuts projected by the median Fed forecast.
The Australian share market (ASX200 accumulation index) was up 5.3% for the quarter, driven by the Information Technology (+24.4%), Property (+16.8%) and Consumer Discretionary (+12.9%) sectors, while Materials (- 6.2%), Communication Services (+1.1%) and Consumer Staples (+2.0%) lagged.
The major banks have been the single most significant driver of index returns for the ASX200, contributing ~45% of the total index return year-to-date despite making up only ~20% of the index weighting.

Source: Goldman Sachs as at 31 Mar 2024
Global equity markets posted strong returns in the March quarter, with the MSCI World Index rising 8.9% in USD and 13.9% in AUD. The sectors with the most significant gains were Communication Services (up 13.7%), followed by Information Technology (12.8%) and Financials (12.0%), while the laggards were Utilities (down 2.2%), Consumer Staples (-4.8%) and Materials (-5.6%). The Japan Nikkei 225 rose 20.6% in the quarter, outpacing the U.S. S&P 500 (10.2%).
In Europe, several countries, including Germany, Finland, the UK, and Ireland, entered a technical recession by posting two consecutive quarters of negative GDP growth for the second half of 2023. The 10-year German government bond yield increased 30bp to 2.3%, broadly in line with movements in global sovereign bond yields.
In Japan, the Bank of Japan ended its negative interest rate policy that had been in place since 2016. Japanese equity returns have benefited from corporate governance changes that promote returns and a return of inflation, which boosts nominal growth rates. The yield on Japanese 10-year government bonds rose 10bp to end the quarter at 0.7%.
Australian capital city home prices rose by 0.6% in March, and annual growth was 8.8%. Every capital city except for Darwin recorded an increase in dwelling values in March, but there are divergences across states and territories. Perth, Adelaide, and Brisbane had the highest pace of growth and strong returns over the past year. dwelling prices in these capital cities are at a record high, while home price growth in Darwin, Hobart and Canberra was softer, and home values are still some ways away from their record levels. Melbourne's price growth has been low in the last quarter, while Sydney's has been stronger, and dwelling values are close to record highs. Out of interest, the median home value in Sydney is the highest at $1,139,75 and the lowest in Darwin at $498,433.

Source : CoreLogic
Market returns for major indices
Below is a table showing the percentage returns of the major market indices to 31st March 2024.

Source: Bloomberg, Lonsec
The outlook for the year ahead
The global economy is expected to continue growing, providing a supportive investment environment. Inflation continues to be higher than desired in some markets, such as the U.S., but it is expected to continue falling into the foreseeable future, which will allow interest rates to come down from present levels.
China remains intent on a 5% GDP growth goal, and this seems achievable through better industrial production and exports. However, its housing market and consumers are fragile. The gradual shift over the past decade to more value-added production capabilities provides potential disruption in a number of global industries and adds a deflationary pulse.
With disruptive innovation as the single most powerful force in capitalism, we see the major technological advancements in Artificial Intelligence (AI) and Generative AI as critically important. While it remains very early in the shift, like the internet, PC, and mobile phone adoption eras, AI will dramatically change organisations’ work and workflow, as well as our personal lives, over the next decade.
The greatest unknown that could destabilise the world economy is an escalation in the Russia/Ukraine war and/or the Middle East.
Did you know?
The price-earnings (P/E) ratio is calculated by dividing the market value price per share by the company's earnings per share. It tells how many years it will take for an investor to get their money back if the company continues to earn what it is currently. For example, a $100 share where the company earns $10 per share would have a P/E ratio 10. A high P/E ratio can mean a stock's price is high relative to earnings and possibly overvalued. A low P/E ratio might indicate that the current stock price is low relative to earnings.
Domestically and offshore, equity market performance over the quarter has been driven predominantly by multiple expansions (the outlook for lower rates) rather than positive revisions for earnings expectations. Market multiples are fully priced relative to history at current levels. Figures 1 and 2 illustrate the price-to-earnings ratio (12-month forward P/E) for the ASX200 and S&P500 versus their long-term averages. The ASX200 currently trades on 16.9x P/E, which is 15% above the 20-year average. The S&P500 trades on 21x P/E, which is ~33% above its 20-year average.
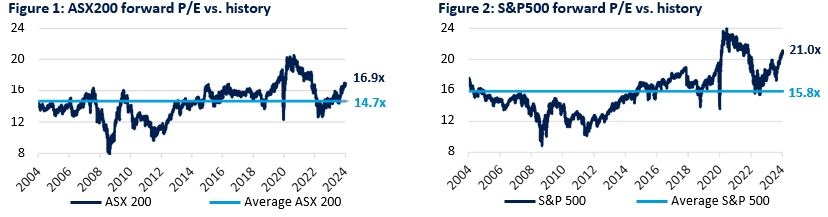
Source: Goldman Sachs Investment Research at 31 Mar 2024
Final reMarc
With strong prospects for corporate earnings and cash flows, we are likely to be entering a period of major new innovation and improved productivity, meaning an exciting backdrop for long-term investors. Further to this, with the U.S. election later this year, measures are in place to ensure economic stability in the U.S. economy as it is almost impossible for the incumbent to be re-elected if the economy is struggling, such as high unemployment.
Continuing to invest through a diversified portfolio across geographic regions, sectors, and fund manager styles is key to managing downside portfolio exposure and delivering more consistent returns over time.
"Success is getting what you want. Happiness is wanting what you get."
Dale Carnegie
Key Facts & Figures
Australian Cash Rate was kept on hold in March at 4.35%.
The RBA Cash Rate is likely (92% chance) to remain on hold in February when the RBA next meet (8% chance of a rate cut).
Our annualised inflation rate is 4.1%. This is well above the upper end of the RBA’s target band of 2 - 3%.
Australia’s unemployment rate is 4.1%.
The US Federal Reserve cash rate band is 5.25% and 5.50%.