
Welcome to the Winter edition of On the Marc. In this edition, we will review markets for the second quarter of 2026 and consider the outlook for the foreseeable future.

Market update
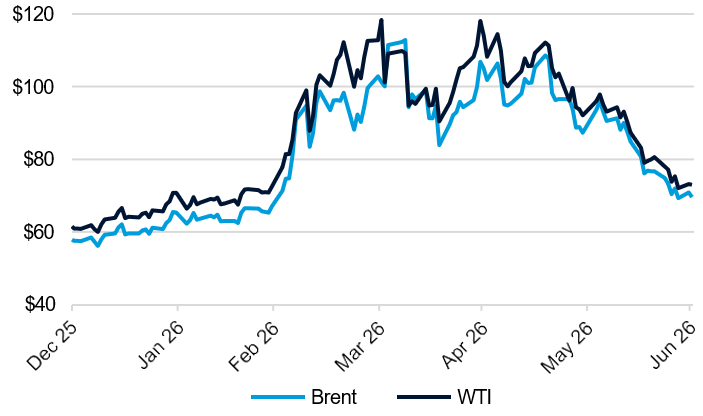
The war in Iran remained a major driver of markets during the June quarter, following the conflict's start and the related oil supply shock in late February. The effective closure of the Strait of Hormuz had driven a sharp spike in oil prices and increased concerns around inflation, interest rates and consumer sentiment. By quarter-end, the announcement of a ceasefire and the gradual normalisation of oil flows led to a substantial fall in energy prices. As shown in Figure 1, oil fell to around US$70/bbl at the end of June (down ~40% from the peak in April). The ceasefire also led to a partial reversal of related equity market trends, with many energy and defensive stocks that had performed well after the start of the war beginning to underperform cyclicals later in the quarter. More recently, renewed tensions and fresh concerns over shipping through the Strait of Hormuz have lifted oil prices back above US$80/bbl, highlighting the ongoing volatility and geopolitical risk premium in energy markets.
Figure 1: Movement in oil prices (US$/barrel)
Source: Bloomberg 30 June 2026
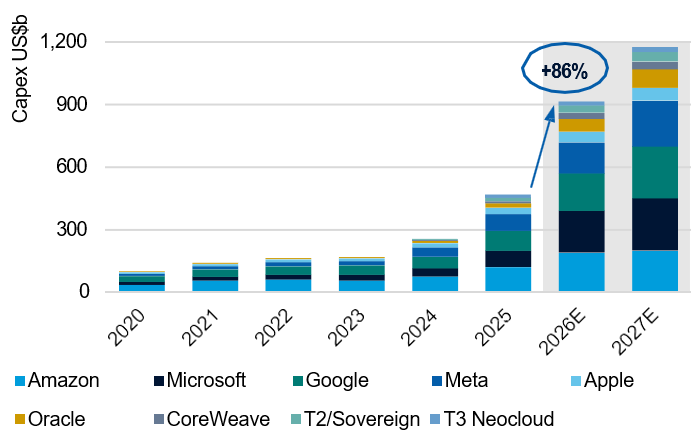
Artificial Intelligence (AI) related stocks performed extremely strongly during the quarter, especially AI infrastructure stocks, driven by strong earnings and substantial capex forecasts from the major hyperscalers. As shown in Figure 2, hyperscaler cloud capex is projected to exceed US$1 trillion in 2027, a more than fivefold increase in only four years.
Figure 2: Hyperscaler capex forecasts
Source: Evercore ISI Research 30 June 2026
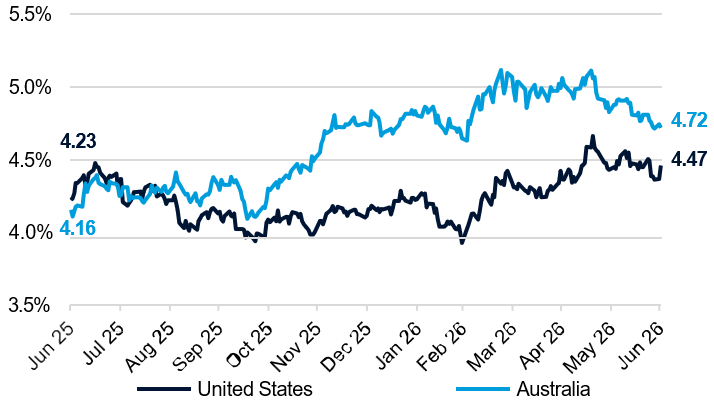
In Australia, the spike in energy costs contributed to an increase in inflation, already elevated at the start of 2026. Headline CPI inflation increased to 4.0% in May, compared to 3.8% in January, and remains well above the RBA’s 2-3% target range. This contributed to the RBA increasing the cash rate again in May, for its third rate hike this year. As shown in Figure 3, the Australian 10-year bond yield increased by over 50 bps over the past 12 months, compared to the U.S. 10-year bond yield, which increased by ~20 bps over the same period. This, in part, reflects Australia’s larger inflation spike and a more hawkish central bank pivot relative to the U.S.
Figure 3: 10-year bond yields (%)
Source: Bloomberg 30 June 2026
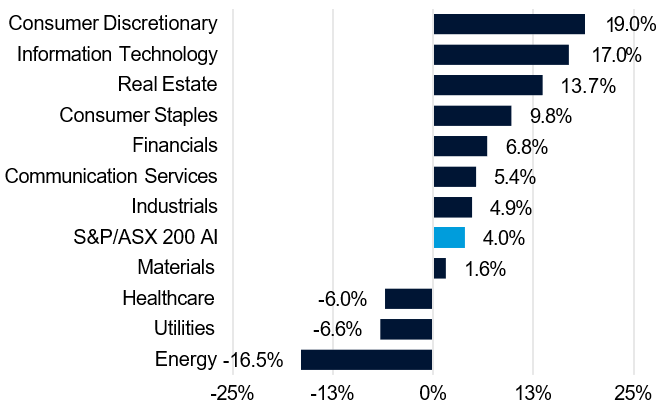
ASX returns were positive for the quarter but lagged most other global equity markets. Unlike other regions, Australia has limited direct exposure to AI investment, other than through selected resources companies that may benefit indirectly from rising demand for data centres and electricity generation. Dispersion in sector performance (refer to Figure 4) was very wide, with ASX Technology stocks recovering in line with the software stocks globally, Consumer Discretionary and Property outperforming amid a lower interest rate outlook, and Energy underperforming significantly as oil prices fell.
Figure 4: ASX200 sector returns – June quarter 2026
Source: CLSA 30 June 2026
Earnings growth remains subdued across many sectors of the Australian economy. A number of large-cap stocks continue to trade at elevated valuation multiples with limited earnings growth and increasing headwinds from recently announced tax changes in the Federal budget. As a result, we continue to believe that the Australian equity market remains fully valued at an index level, particularly the ASX20. Outside of this area, we continue to find several compelling stock-specific opportunities in the domestic market.
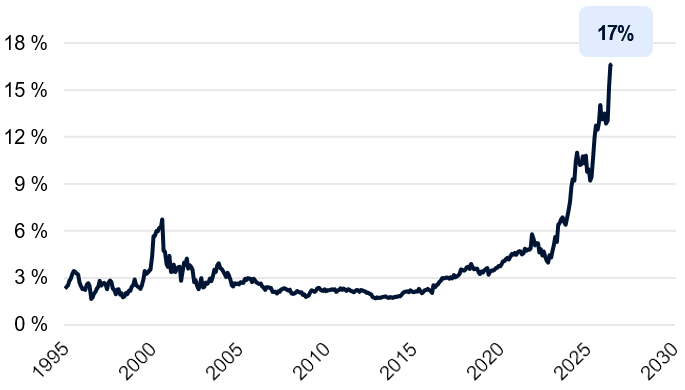
U.S. equity markets performed very strongly over the quarter (S&P500 +15%, Nasdaq +22%). This performance has been almost entirely driven by a narrow group of AI-linked capex beneficiaries. Figure 5 illustrates the sharp spike in semiconductor stock performance, which nears one-fifth of the S&P 500 index at the end of June. This amounts to a quadrupling in index representation since June 2020. Meanwhile, the performance of non AI related stocks in the index more closely reflects other global markets and remains relatively subdued.
Figure 5: Weight of semiconductor stocks in the S&P500
Source: Goldman Sachs Investment Research 30 June 2026
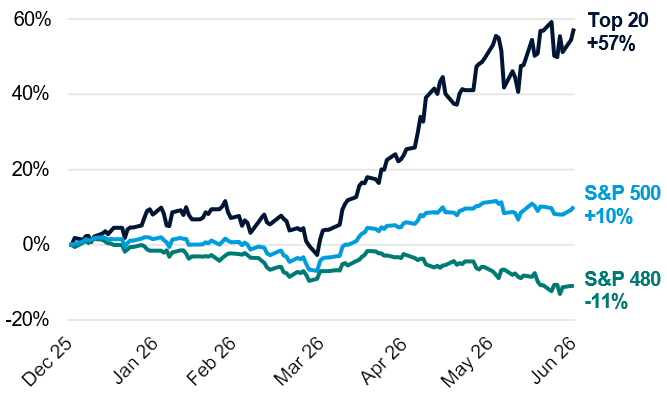
Figure 6 illustrates the extent of this narrow market leadership: the top 20 performing stocks in the S&P 500, which are predominantly AI related, have delivered very strong year-to-date returns, while the remaining ~480 constituents have collectively declined meaningfully over the same period.
Figure 6: S&P500 performance (1 January – 30 June 2026)
Source: Goldman Sachs Investment Research as at 30 June 2026
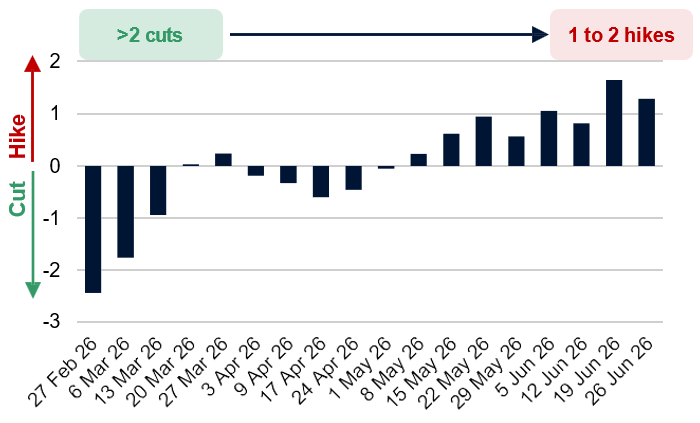
Recent U.S. economic data have been mixed. Inflation increased during the quarter, driven by higher energy costs, while the labour market remained resilient despite some signs of slower hiring activity. The most significant change has been the shift in U.S. interest rate expectations. At Kevin Warsh’s first meeting as Fed Chair in June, the FOMC left rates unchanged but struck a more hawkish tone, reinforcing a higher-for-longer stance and pushing the U.S. rates curve higher. Markets have shifted nearly 100bps higher since the start of the year, from pricing in over two rate cuts in February to between one and two rate hikes currently (see Figure 7).
Figure 7: Fed hikes/(cuts) priced by year end
Source: Morgan Stanley, one cut/hike assumes 25bp move
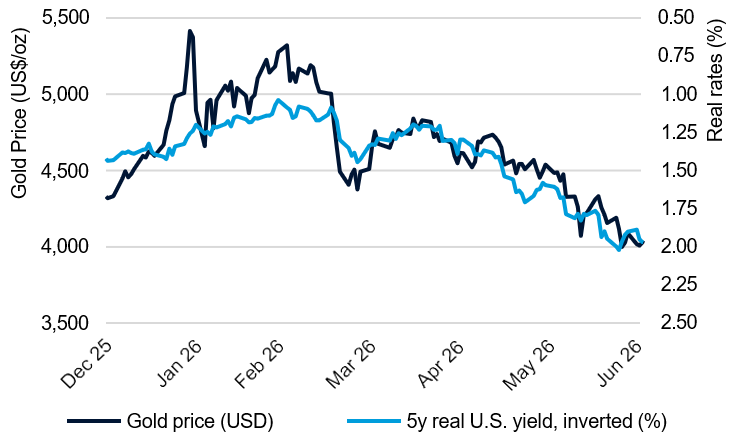
We have seen the impact of this rate movement on gold, where the price pulled back sharply over the quarter despite elevated geopolitical risks. As shown in Figure 8, the gold price has moved lower as real interest rate expectations have increased. This reflects the higher opportunity cost of holding gold, which pays no income, as well as the support that higher rates have provided to the U.S. dollar. Investor demand also softened, with physical gold ETFs seeing significant outflows, particularly in North America, as capital rotated towards AI-related equities and other areas of market leadership. The weakness was further exacerbated by one-off policy responses from oil-importing countries, including Turkey's gold reserve sales and higher Indian import taxes. While these factors weighed on short-term sentiment, longer-term drivers (central bank accumulation, persistent fiscal deficits and elevated geopolitical risk) of a positive return for gold remain intact.
Figure 8: Gold price versus real interest rates
Source: Bloomberg June 2026
Market returns for major indices
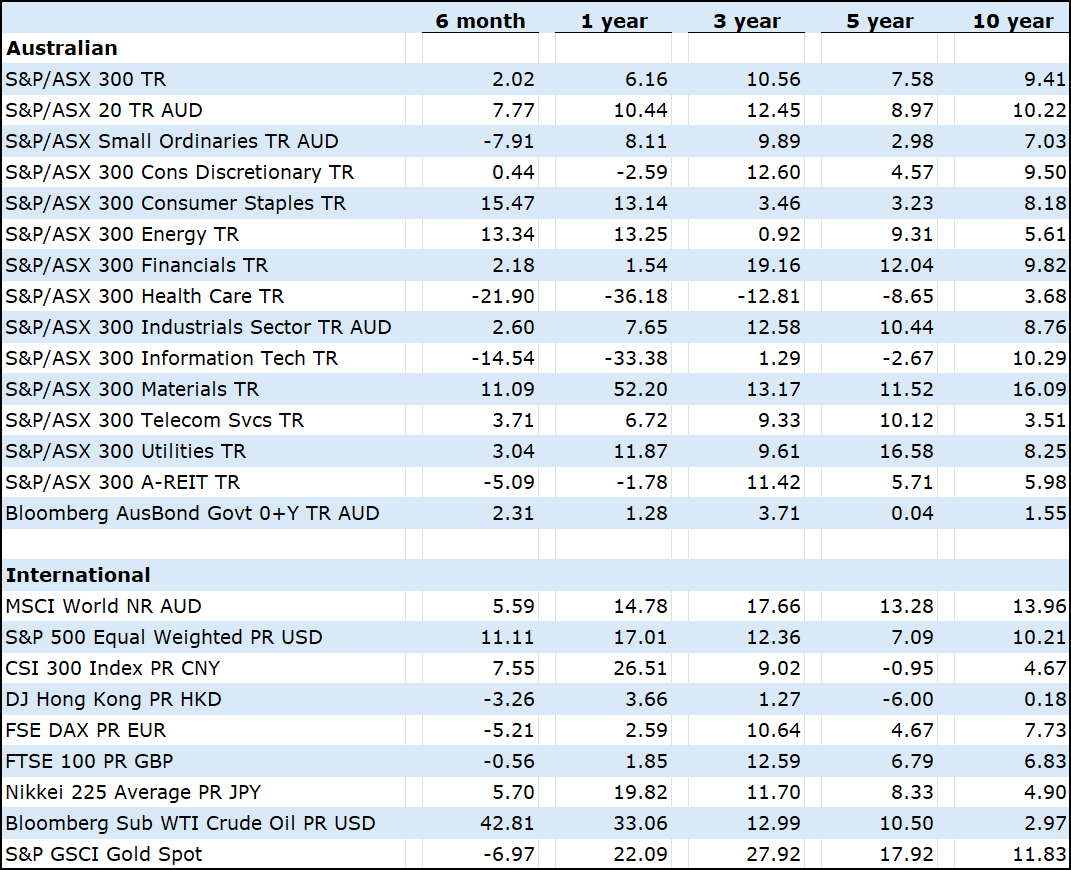
Below is a table showing the percentage returns of the major market indices to 30th June 2026.
Source: Morningstar
The outlook for the year ahead
Will the global economy grow over the coming year?
With oil futures prices now significantly below their recent peak and AI capital expenditure continuing to rise, though risks remain, global growth is expected to accelerate over the coming year, expanding by an above average 3 per cent.
How is the US economy performing?
As the centre of the global AI boom, the United States is expected to lead the economic rebound as investment growth broadens beyond AI and into wider capital expenditure.
Will China hit its growth target in 2026?
Despite strong export performance, China's growth has fallen below the government's stated target of 4.5–5.0 per cent, meaning authorities will likely look to boost domestic demand to meet it.
What is the outlook for Europe's economy?
European output is expected to gradually recover if the disruption to oil supplies eases. However, higher inflation and a rise in interest rates mean growth will likely remain below long term averages until next year.
How is Australia’s economy performing?
Growth in Australia is expected to remain subdued for much of 2026 as the combined impact of interest rate increases and the Federal Budget weighs on the housing market.
Did you know?
Japan stood out among developed-world indices in terms of performance, with the Nikkei225 rising 5.6% in June to finish the quarter up 37.2% in local currency terms. In addition to reaching new all-time highs, the Nikkei225 also recorded its best quarter since 1965, with semiconductors and AI supply-chain beneficiaries driving the bulk of returns.
Final reMarc
Despite recent uncertainty over the Middle East peace deal, most share market indices around the world continue to trade at or near all time highs. This is largely due to the exceptional growth rates of the AI enablers. Global returns have been concentrated, which is why holding a diversified growth portfolio is expected to provide more consistent and stronger returns in the future. Having significant exposure to the best performers over the past 12 to 24 months is considered risky, as many of these companies’ future profit targets are ambitious. For companies outside of the AI high flyers to perform, it will be interesting to see if the efficiencies AI is widely hyped to deliver will, in fact, translate to larger bottom line profits.
" You can't make money with a consensus accurate prediction. "
Bill Gurley
Key Facts & Figures
The Australian Cash Rate was on hold at 4.35% at the June meeting.
The RBA is likely to hold the Cash Rate at the August meeting (84% chance rates remain unchanged).
Our annualised inflation rate is 4.0%. This is above the RBA’s target band of 2 - 3%.
Australia’s unemployment rate increased to 4.5%.
The US Federal Reserve's target range for the federal funds rate remains at 3.50% - 3.75%.