
Welcome to the Spring edition of On the Marc. In this edition, we will review markets for the second quarter of the 2027 financial year and consider the outlook for the foreseeable future.

Market update
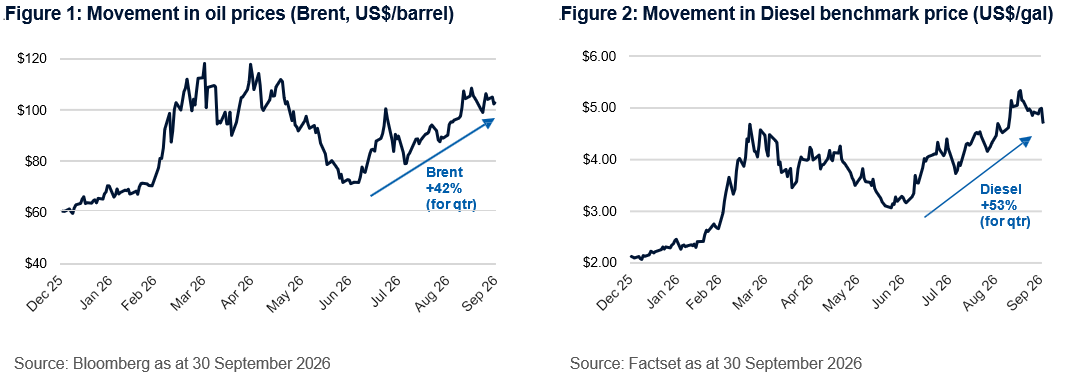
Middle East tensions re-escalated in the September quarter after the short ceasefire broke down at the start of July. Constrained shipping through the Strait of Hormuz and attacks on Saudi Arabia’s Red Sea export routes drove a 42% increase in Brent crude prices during the quarter (see Figure 1). Meanwhile, global inventories of oil and refined products continued to decline, amplifying inflation concerns. Diesel prices, a critical input into global supply chains, rose even more than crude oil, reflecting reduced Gulf exports, damage to Russian refineries from Ukrainian attacks, and Russia’s restrictions on diesel exports (see Figure 2).
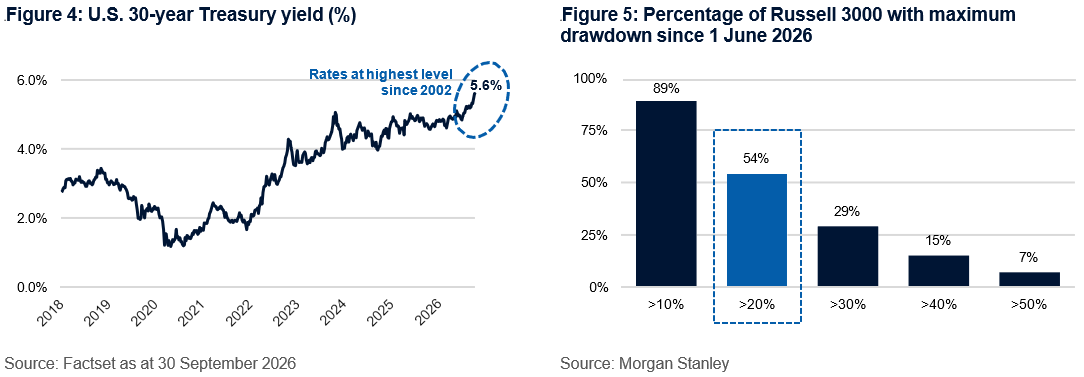
Higher energy prices fueled inflation concerns and prompted central banks worldwide to adopt more hawkish policy settings. In the U.S., the FOMC raised rates for the first time since 2023, with members projecting another hike by year-end. Figure 4 shows U.S. interest rates over the past eight years.
In Australia, the RBA delivered its fourth 25bp hike of the year in September. The Board noted that upside inflation risks were materialising, citing domestic capacity pressures, rising technology goods prices associated with AI demand, and energy prices. Markets now price in one further RBA hike by mid-2027, for a total of five hikes since the start of 2026 (up from one to two hikes priced in for 2026 at the start of the year). This amounts to an +87bps repricing in cash rate expectations since the start of 2026, including +53bps in the September quarter alone. These moves, along with prolonged fiscal deficits and large AI-related financing needs, contributed to a rise in long-term bond yields during the quarter. The U.S. 30-year Treasury yield ended the quarter at 5.60%, its highest level since 2002.
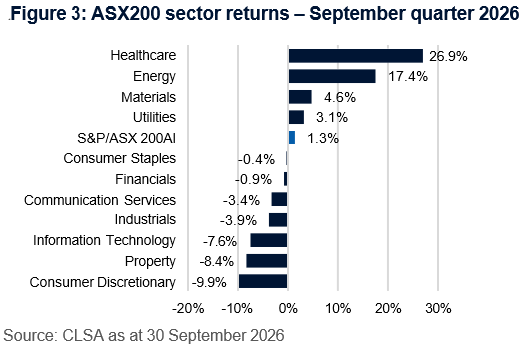
Despite the rise in long-term bond yields, headline equity indices remained resilient, though performance was narrow and dispersion beneath the surface was extreme. The ASX200AI returned +1.3% over the quarter, led by Healthcare (+26.9%), Energy (+17.4%), and Materials (+4.6%), while Consumer Discretionary (-9.9%), Property (-8.4%), and Information Technology (-7.6%) lagged (see Figure 3).
U.S. equities also advanced modestly (S&P500 +2.0%, Nasdaq +2.5%), supported by another quarter of strong earnings growth. However, both earnings growth and index performance remained heavily concentrated in a narrow cohort of AI related stocks. Figure 4 shows stock drawdowns across the Russell 3000 Index, which tracks the performance of the 3,000 largest publicly traded companies in the U.S. and provides a broad view of the U.S. equity market. Since the start of June, over half of Russell 3000 constituents have seen a share price drawdown of more than 20%, while nearly 90% have had a maximum drawdown of more than 10%.
Market returns for major indices
The table below shows the percentage returns of the major market indices as of 30th September 2026.
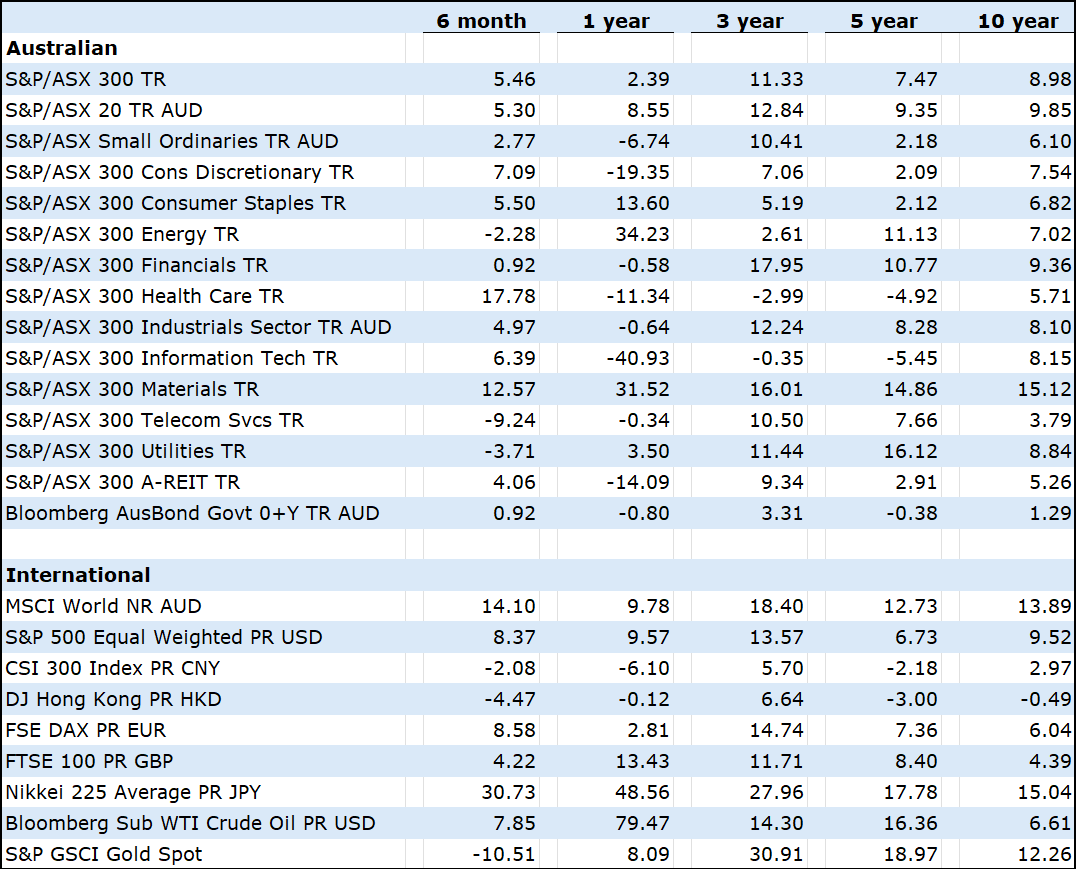
Source: Morningstar
The outlook for the year ahead
Looking ahead to the remainder of 2026 and into 2027, the investment backdrop has become remarkably complex, shaped by unresolved geopolitical friction, a sharp repricing in global fixed income, and an unprecedented capital spending boom around AI. While major equity benchmarks have demonstrated surprising resilience, with the S&P 500 hovering near record highs and the Australian share market trading within arm’s reach of its all-time peak, the underlying mechanics driving asset classes are more complicated and divided.
The trajectory of the Middle East conflict remains a central macro driver. Earlier hopes that the Iran conflict would reach a swift, permanent resolution have given way to persistent friction along the Strait of Hormuz, pushing global oil benchmark prices back above US$100 per barrel and reigniting energy-driven inflation risks. While domestic energy production in the United States continues to buffer its economy from historical oil shocks, sustained elevated energy costs present a persistent headwind for global growth and corporate profit margins.
At the same time, the global macroeconomic regime has shifted as central banks respond to stubborn inflation and fiscal spending pressures. Higher borrowing costs are no longer just a theoretical discount rate consideration for equity valuations, but a practical drag on real economic activity, housing affordability, and businesses with leveraged balance sheets. For income investors, however, these elevated yields continue to offer some of the most compelling defensive return profiles in well over a decade.
Equity markets are rapidly moving away from treating AI as a tide that lifts all boats. As hyperscalers and enterprises commit vast capital expenditure toward infrastructure and compute power, investors are becoming far more discerning, distinguishing true, cashflow accretive technology beneficiaries from overleveraged models or cyclical industrial businesses temporarily caught in valuation markdowns. Beyond technology, significant valuation disparities have emerged across global sectors ranging from depressed multiples in European financials and healthcare to stretched valuations in domestic quality defensives (e.g. Woolworths and Telstra).
Did you know?
Research on how people spend their days shows that retirees gain roughly 3 to 4 hours of pure discretionary time each day compared to working adults.
Retirement isn't just a break from work; it's a massive time dividend. Financial planning isn't just about managing capital; it’s about funding the activities and passions that turn those extra 1,000+ hours a year into meaningful experiences.
Final reMarc
Navigating the year ahead will require balancing patience. Market outcomes will likely remain volatile as markets navigate tight monetary settings, fiscal deficits, geopolitical uncertainty, weaker GDP growth, negligible productivity growth, and sticky inflation. The ASX200 remains highly concentrated in a small number of large-cap stocks. The largest 20 companies account for roughly 60% of the index and, in aggregate, have relatively moderate earnings growth prospects, with further risk from the tougher domestic economy. For this reason, we continue to believe a diversified, actively managed portfolio is likely to deliver more consistent returns over time and avoid overvalued areas of the market. It is also important to keep at the forefront of our minds the importance of taking a long term perspective when investing in growth assets, as there is always going to be volatility to the downside over shorter time frames. Ultimately, what counts is the medium to long term outcome.
" I prefer to be optimistic and wrong rather than pessimistic and right. "
Elon Musk
Key Facts & Figures
The Australian Cash Rate rose 0.25% at the September meeting to 4.60%.
The RBA is likely to hold the Cash Rate at the November meeting (78% chance rates stay the same).
Our annualised inflation rate is 4.0%. This is above the RBA’s target band of 2-3%.
Australia’s unemployment rate increased to 4.7%.
The US Federal Reserve cash rate band is 3.75%-4.00%.